
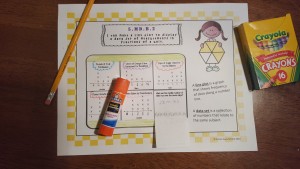
One of the fifth grade standards (5.MD.B.2) asks students create line plots that display measurements in fractions of a unit. I don’t know why, but students have a hard time interpreting information from line plots. However with enough exposure and practice, they can become masters of this often difficult concept.
I looked online to find resources to help me teach this concept but found mostly task cards. While I love task cards and use them a lot, I really needed a resource that was all encompassing: pre-assessment, notes, practice pages and games, and finally a post assessment.
I created this resource myself and hope that others find it as helpful as I have. You can find this resource by clicking here.

After taking the pre-assessment, I guided my students through interpreting line plots using this fun and engaging interactive notebook,
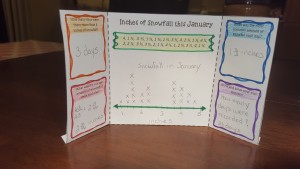
Students then practiced making line plots and creating their own questions using this trifold. My kiddos loved making the this foldable because it stood up. I couldn’t believe how something so simple could turn an otherwise routine practice opportunity exciting.
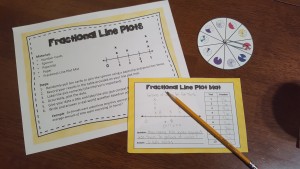
Students also practiced creating their own line plot using the fractional line plot mat. Each kiddo had the choice of using spinners or cards to collect their data. They then recorded their results in a table, created a line plot, then wrote and answered their own question. This helped my students to put context and meaning behind the numbers which was extremely powerful!
Finally, it was time to give the post assessment. My kiddos did great, and I am so happy that they have mastered what has historically been a challenging concept in the past.